
Ask three people what affects a carbon footprint most and you may hear three confident guesses: driving, electricity, food, or flights. None is automatically wrong, because the answer depends on the size of each activity in your actual life. What settles the argument is not intuition but arithmetic, and the arithmetic runs on published emissions factors.
A footprint estimate is not a moral score. It is a model that converts activity data (kilowatt-hours, gallons, flights, meals) into estimated greenhouse gas emissions using a factor for each activity. BlinkCalc's Carbon Footprint Calculator does exactly that. This guide shows the factors it uses, where those factors come from, and which inputs actually move the total.
What carbon footprint means
A carbon footprint estimates the greenhouse gases connected to an activity, household, product, or lifestyle. Results are expressed as carbon dioxide equivalent, or CO2e, which converts each gas into the amount of CO2 that would cause the same warming over a chosen time horizon, normally 100 years. That conversion is why methane and nitrous oxide can be added to CO2 in a single figure, and also why two studies using different time horizons or different global warming potentials can report different CO2e for identical activity.
Personal calculators group inputs into home energy, transport, flights, food, and general consumption. Each category uses one or more emissions factors. The output is an estimate with real uncertainty, but it is reliable enough to rank your own categories against each other, which is the job most people need it for.
The factors behind the arithmetic
These are the defaults BlinkCalc uses, alongside the published figures they track. Knowing the factor is what lets you sanity-check any footprint tool, including this one.
| Activity | Factor used | Published reference |
|---|---|---|
| Electricity, average grid | 0.39 kg CO2e per kWh | EPA eGRID2022 US average output rate is 823 lb CO2/MWh, about 0.37 kg per kWh |
| Electricity, low-carbon grid | 0.15 kg CO2e per kWh | Regional eGRID subregions with high hydro or nuclear share fall well below the national average |
| Electricity, high-carbon grid | 0.65 kg CO2e per kWh | Coal-heavy eGRID subregions sit well above it |
| Gasoline | 8.89 kg CO2 per US gallon | EPA uses 8,887 grams of CO2 per gallon of gasoline burned |
| Natural gas | 5.3 kg CO2 per therm | EPA uses 0.0053 metric tons of CO2 per therm |
| Flights, per round trip | 250 / 650 / 1,600 kg for short / medium / long haul | Route, aircraft, cabin class, load factor, and whether non-CO2 effects are counted all shift this; the UK government publishes per-passenger-km factors with and without an uplift for those effects |
| Diet, per person per year | 1,500 to 3,300 kg depending on pattern | Poore and Nemecek's review of about 38,700 farms across 119 countries found large spreads both between and within food types |
Two things follow from the table. First, the headline factors are not secret, which means any tool's numbers can be checked. Second, the electricity factor is the one most likely to be wrong for you personally, because it varies more by location than any other line.
Home energy
Home energy covers electricity, heating, cooling, hot water, cooking, and appliances. The same kilowatt-hour carries very different emissions depending on the local grid mix: a coal-heavy grid can be four times the intensity of a hydro or nuclear heavy one. This is the single largest source of disagreement between calculators, and the reason a footprint tool that does not ask where you live should be treated as a rough teaching aid.
Grid intensity also moves through the day and the year as renewable output rises and falls. Simple calculators use annual averages because almost nobody has hourly data, which is defensible for an educational estimate but worth remembering when you compare two results.
Cost and carbon are related but not identical. A cheap kilowatt-hour can carry higher emissions than an expensive one. The Electricity Cost Calculator is useful for pinning down your actual kWh before applying any factor.
Heating and cooling are shaped by climate and by the building more than by behaviour. A poorly insulated home in a cold region can use several times the energy of a small apartment in a mild one. That matters for advice as much as for arithmetic: a renter usually controls thermostat settings and drafts, not insulation, windows, or the heating system. A calculator can tell you how large the category is; what you can do about it depends on what you control.
For scale, the EPA's own household calculator assumes a US average of roughly 8,700 lb of CO2 a year from household electricity and roughly 6,900 lb from natural gas, which is about 4.0 and 3.1 tonnes respectively. Home energy alone is therefore often the largest or second-largest category for a US household.
Transport and commuting
Transport is frequently large because the fuel combustion is direct, well understood, and repeated. The arithmetic is unusually clean: distance divided by fuel economy gives gallons, and gallons times 8.89 kg gives CO2.
So a car driven 120 miles a week at 30 mpg burns about 208 gallons a year, which is about 1,849 kg of CO2. The same mileage at 20 mpg burns 312 gallons, about 2,774 kg. Fuel economy and distance are the only two levers that matter much here, and both are measurable rather than guessed. The Fuel Cost Calculator will give you the fuel figure directly.
Vehicle type shifts the result substantially: an efficient hybrid roughly a third below a comparable petrol car, a battery electric vehicle substantially lower again but not zero, because the emissions move from the tailpipe to the grid and therefore depend on the same electricity factor discussed above. Diesel carries slightly more CO2 per gallon than gasoline because of its higher carbon content per unit volume.
Flights and long-distance travel
Flights can dominate a year even when they are rare, because a single long-haul round trip is a large amount of fuel compressed into two days. But "flights always dominate" is too strong a claim, and the worked example below shows why.
Flight estimates vary by route, aircraft, cabin class, occupancy, and methodology. The largest single methodological choice is whether non-CO2 effects at altitude, such as contrail formation and nitrogen oxides, are counted; the UK government publishes factors both with and without an uplift for these, and the two differ substantially. Treat any flight figure as an approximate planning number, not personal accounting.
Diet and food waste
Diet estimates account for production, processing, transport, storage, and waste. The most-cited dataset here is Poore and Nemecek's 2018 review in Science, which assembled life-cycle data from around 38,700 farms in 119 countries. Its most useful finding for an individual is not a ranking of foods but the size of the spread: emissions for the same product vary several-fold between producers, so where and how something was grown can matter as much as what it is.
Food waste deserves its own line. Food that is grown, shipped, refrigerated, cooked, and then thrown away carries its full impact while providing no nutrition. In BlinkCalc's model, moving from high waste to low waste changes an average diet's estimate by about 625 kg CO2e a year, comparable to swapping a meat-heavy pattern for an average one (about 800 kg). Waste is often the easier of the two to change, because it targets loss rather than identity: planning flexible meals, freezing leftovers, buying smaller quantities of perishables, and keeping a shelf for food that needs eating soon all reduce cost at the same time.
Consumption beyond the bills
Most personal calculators include a broad consumption category, because clothing, electronics, furniture, appliances, repairs, and deliveries all carry emissions embedded in production and transport. These are genuinely harder to estimate than fuel, since the emissions occur across supply chains that no household can see.
Simple tools therefore use spending as a proxy. BlinkCalc applies roughly 0.45 kg CO2e per unit of monthly discretionary spend. That is rough by construction, and is best read as a reminder that a footprint is not only what happens at the wall socket or the pump. Repairing, buying used, and choosing durable goods matter most for high-impact items rather than for every purchase.
A worked household footprint
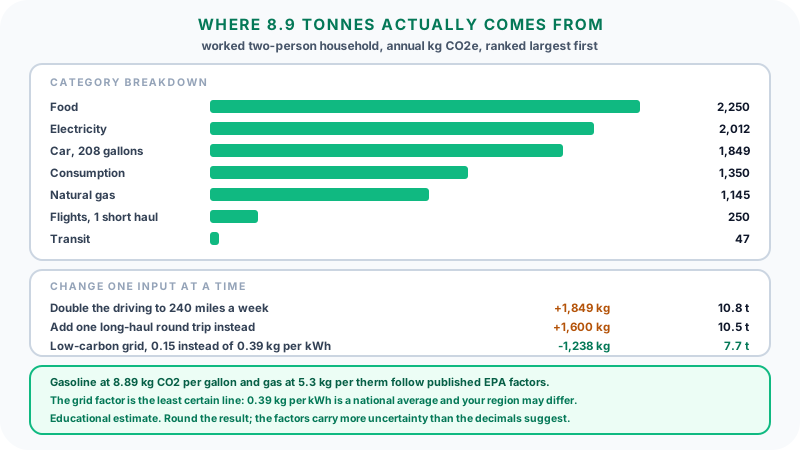
A two-person apartment with: 430 kWh of electricity a month on an average grid, 18 therms of gas a month, 120 miles of driving a week at 30 mpg, 10 miles a week of transit, one short-haul round trip in the year, an average diet with low food waste, and about 250 a month of discretionary spending.
| Category | Annual CO2e |
|---|---|
| Electricity (430 kWh x 12 x 0.39) | 2,012 kg |
| Natural gas (18 therms x 12 x 5.3) | 1,145 kg |
| Car (208 gallons x 8.89) | 1,849 kg |
| Food (2,500 x 0.9 for low waste) | 2,250 kg |
| Consumption | 1,350 kg |
| Flights (one short round trip) | 250 kg |
| Transit | 47 kg |
| Household total | 8,903 kg, about 8.9 tonnes |
| Per person | about 4.5 tonnes |
Now change one input at a time, which is where a calculator earns its keep:
- Double the driving to 240 miles a week: transport rises to 3,698 kg and the total to 10.8 tonnes. Driving becomes the single largest category.
- Add one long-haul round trip instead: the total rises to 10.5 tonnes. Note that it adds slightly less than doubling a moderate commute, which is why "flights dominate" is a claim to test rather than assume.
- Move to a low-carbon grid at 0.15 kg per kWh: electricity falls from 2,012 kg to 774 kg, a saving of about 1,238 kg for no change in behaviour at all.
That last line is the most important one in the article. The biggest single reduction available to this household comes from where its electricity is generated, which is mostly not a habit.
Big levers and small levers
A useful estimate separates large categories from small ones. In the example above, turning off unused lights is sensible and affects a few kilograms. Halving the commute, improving insulation, or a cleaner electricity supply affect hundreds or thousands. The point is not that small habits are worthless but that attention is finite and should follow the arithmetic.
Trade-offs are normal and the estimate should make them visible. Working from home cuts commuting and may raise home heating; moving closer to work cuts driving and may raise rent. So compare specific scenarios rather than resolving to "drive less": one remote day a week against two, against carpooling once a week, and see which actually moves the number.
Household size and units change the answer
A footprint can be reported per household or per person, and the two tell different stories. Two people sharing an apartment may use more total electricity than one person in a studio but less each. A car with four passengers produces more total emissions than one person on a bus but can be lower per passenger-mile.
So check the denominator before comparing anything: annual household CO2e, annual per-person CO2e, emissions per mile, emissions per kWh, and emissions per unit of spending are five different quantities. Mixing them produces comparisons that look rigorous and mean nothing.
Avoiding false precision
Carbon estimates often display tidy numbers, but the underlying uncertainty is larger than the decimal places imply. A result of 7.42 tonnes does not mean 7.41 is wrong. The figure is built from averaged factors applied to self-reported activity.
Round numbers are usually more honest. If transport is roughly 3.7 tonnes and electricity is roughly 2.0, the planning insight is clear whichever published factor set you use. Use precision to compare scenarios against each other, not to claim the model sees everything.
It also helps to separate direct from indirect estimates. Fuel and metered energy are firm: you know the gallons and the kilowatt-hours. Food and consumption figures are directional, built on averages from supply chains you cannot observe. Both belong in the total; they do not deserve equal confidence.
Recalculate after real changes
Footprints swing year to year with a new commute, a house move, a different heating system, or an unusual travel year. Label the unusual years rather than treating them as a new baseline, and keep the old estimates: they show whether a change reduced the total or merely moved emissions between categories. When units get confusing across joules, BTU, therms, and kWh, the Energy Converter prevents a mistake no emissions factor can fix.
Common mistakes
Focusing on visible habits. A charger on the counter is visible; heating, cooling, commuting, and flights are larger.
Comparing people without context. Climate, housing stock, transit access, household size, job location, medical needs, and grid mix all shape the result.
Treating the output as exact. Emissions factors are averages and behaviour varies month to month.
Double counting. If household electricity is already entered, do not add the same appliance's kWh again unless the tool asks for itemised use.
Ignoring the grid factor. Using a generic national average when your own region is far above or below it is the largest avoidable error in most personal estimates.
FAQ
What does carbon footprint mean?
An estimate of the greenhouse gas emissions linked to a set of activities, expressed as CO2e so that different gases can be added together.
Which choices move the number most?
Whichever categories are largest in your actual life. For most households that is home energy, driving, flights, or food, and the ranking differs by person and by place.
Why do estimates vary by country?
Electricity grid mix is the biggest reason, followed by heating fuel, transport systems, food supply chains, and which published factor set the tool uses.
Do flights matter more than daily habits?
Sometimes. A long-haul round trip is large, but in the worked example above it added slightly less than doubling a moderate car commute. Compare the actual numbers rather than assuming.
Can a calculator give an exact footprint?
No. It gives an educational estimate. Formal reporting needs verified activity data, documented factors, and a recognised accounting method.
Should I focus on small habits first?
Identify the largest categories first. Small habits are worth keeping, but scale should set the priority order.
Sources
- Greenhouse Gas Equivalencies Calculator, calculations and references - US Environmental Protection Agency. Source for 8,887 grams of CO2 per gallon of gasoline burned, 0.0053 metric tons of CO2 per therm of natural gas, and the eGRID2022 US average output emission rate of 823.1 lb CO2 per MWh used as the reference for the electricity factor.
- Assumptions and references for the Household Carbon Footprint Calculator - US Environmental Protection Agency. Source for the US average household figures of about 8,700 lb of CO2 a year from electricity and 6,900 lb from natural gas.
- Reducing food's environmental impacts through producers and consumers - Poore and Nemecek, Science 360, 987 to 992 (2018). Peer-reviewed source for the food life-cycle dataset covering about 38,700 farms in 119 countries, and for the finding that emissions vary several-fold within the same product.
- Government conversion factors for company reporting of greenhouse gas emissions - UK Department for Energy Security and Net Zero. The official UK factor set, including per-passenger flight factors published both with and without an uplift for non-CO2 effects at altitude.
- eGRID - US Environmental Protection Agency. Subregional US electricity emission rates, which is where to find a grid factor for your own location rather than using a national average.
Educational estimate only. Emissions factors vary by country, energy mix, transport type, and methodology, and the published factor sets above are updated periodically.