
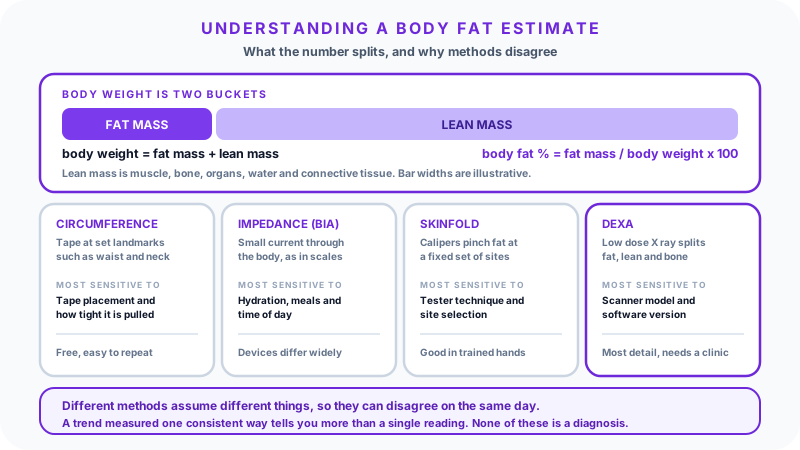
A body fat percentage looks precise. A calculator returns something like 21.4%, and it is tempting to treat that number as a hard fact. It is better understood as an educated estimate. Knowing what it measures, and what it cannot, helps you use the number well instead of worrying about a single decimal.
The arithmetic behind the number
Every body fat estimate rests on one simple split. Your body weight is divided into two buckets:
body weight = fat mass + lean mass
Fat mass is the weight of the fat tissue you carry. Lean mass is everything else: muscle, bone, organs, connective tissue, and the large amount of water your body holds. Body fat percentage is just the first bucket expressed as a share of the whole:
body fat % = fat mass / body weight x 100
Run that with real figures. Someone who weighs 80 kg with an estimated 20% body fat is being described as roughly 16 kg of fat mass and 64 kg of lean mass. If that same person later weighs 78 kg at an estimated 18%, the split becomes about 14 kg of fat and 64 kg of lean. The scale moved 2 kg; the estimate is suggesting that essentially all of the change sat in the fat bucket.
Why the percentage and the scale disagree
Because the percentage is a ratio, it can move when either bucket changes. That produces situations the bathroom scale cannot explain on its own.
Body weight can hold steady while the estimate falls, if fat mass drops and lean mass rises by a similar amount. This is a common pattern for someone new to resistance training. Body weight can fall while the estimate barely moves, if the loss came from both buckets in roughly the proportions you already carried. And the percentage can drift upward during a period of illness or inactivity even with a stable weight, if lean mass declines.
This is the practical case for looking at composition at all. Weight alone tells you the total; it says nothing about which bucket changed. Keep in mind that a consumer estimate infers the split rather than weighing the two buckets separately, so treat these readings as directional.
How body fat differs from BMI
BMI and body fat answer different questions. BMI uses only height and weight, so by construction it cannot separate the two buckets. The BMI Calculator and the related BMI Prime Calculator are quick population-level screening tools, which is exactly how the National Heart, Lung, and Blood Institute frames them. A heavily muscled person can land in a high BMI category while carrying comparatively little fat, and an older adult who has lost muscle can sit in a mid BMI category with a higher fat share than the number suggests.
Body fat formulas take in more shape information, such as waist, neck, hip, age, and sex, so they attempt to describe composition rather than weight for height alone. That is a genuine improvement in what is being asked, but it is not a leap in precision. Neither figure is a diagnosis. Many people read both side by side and treat each as a screening number.
Four ways body fat gets estimated
The common methods trade convenience against consistency, and each has its own dominant source of error. They are not all sensitive to the same things, which is the main reason two methods can hand you different numbers on the same morning.
Circumference formulas use tape measurements such as waist, neck, and sometimes hip, together with height, age, and sex. The U.S. Navy method is the best known example. These are free, quick, and easy to repeat. Their weak point is tape technique: where you place the tape, how level you hold it, and how much you tighten it. They also assume your fat is distributed like the population the formula was built from, which is why they can misjudge people at the extremes of shape or training history.
Bioelectrical impedance (BIA) sits inside most smart scales and handheld devices. It passes a small current through the body and infers composition from the resistance it meets. Because that resistance depends heavily on body water, BIA readings are the most sensitive of the four to hydration status, recent meals, alcohol, exercise, and time of day. Different devices also use different proprietary equations, so two scales can disagree with each other while each stays fairly consistent with itself.
Skinfold calipers pinch subcutaneous fat at a fixed set of sites. In trained hands and with a consistent site protocol, they track change well. Their dominant error source is the tester: site location, pinch depth, and timing of the reading vary between people, and often between sessions with the same person. They also only sample fat directly under the skin at the chosen sites.
DEXA (also written DXA) uses low-dose X-ray absorptiometry to estimate fat mass, lean soft tissue, and bone mineral separately, and can report where the fat sits. It is the most detailed of the four and is often used as the reference standard in research, but it is not a perfect instrument either: results vary somewhat between scanner manufacturers and software versions. It also costs money, requires an appointment, and involves a small radiation dose.
A method can be highly repeatable without being exactly correct. That distinction matters more than it sounds, because repeatability is what makes tracking useful, and it is the property home methods are most likely to have.
What actually moves an estimate
When a reading changes, it is worth asking which of these is responsible before concluding your body changed:
- Method. A tape formula and a DEXA scan are answering the same question with different instruments and different assumptions. Their numbers are not interchangeable.
- Device. Two BIA scales can differ by several percentage points because their internal equations differ.
- Technique. Tape placement and caliper site selection are the largest lever on circumference and skinfold results respectively.
- Hydration and timing. These weigh most heavily on BIA. A morning reading before drinking and an evening reading after a workout are not comparable. Circumference and DEXA are less exposed to this, though not entirely immune, since bloating changes waist measurements.
The takeaway is not that the methods are unreliable. It is that a number only means something alongside the conditions that produced it.
How the calculator uses your measurements
The Body Fat Calculator applies a circumference formula. You enter height, neck, and waist, plus hip for women, and it returns an estimated percentage.
Because the inputs are circumferences, small input differences matter. Consider a man who is 178 cm tall with a 38 cm neck. An 86 cm waist entry returns roughly 17%. Change only the waist to 89 cm and the same formula returns roughly 20%. Nothing about his body changed between those two numbers; a 3 cm difference in where the tape sat did all the work.
That sensitivity is a feature as much as a flaw. It is why the tool can pick up a genuine trend over months, and equally why a sloppy measurement can invent one. Measuring at the same landmark, at the same time of day, under similar conditions, is what separates the two.
Reading the number over time
Treat the percentage as a trend line rather than a verdict. A single reading, taken once, tells you very little. The same method repeated under similar conditions every few weeks shows a direction, and the direction is the useful part.
A workable habit looks like this. Pick one method and stay with it. Measure under consistent conditions: same tool, similar time of day, similar hydration, same landmarks. Record the result rather than trusting memory. Then wait two to four weeks before the next reading, because composition responds to weeks of habits and not to yesterday. When you review, look at three or four readings together. A change that shows up once and disappears is usually measurement noise; a change that persists across several readings is more likely to be real.
Compare your results to your own earlier results. Comparing your tape estimate to a friend's scale reading, or to a figure quoted online, compares two different instruments as much as two different bodies.
About published reference ranges
You will find tables of body fat ranges labelled by sex and age, and organisations such as the American Council on Exercise publish widely quoted versions. They are useful for orientation, and they are worth reading carefully rather than literally.
Those ranges come from different reference populations, measured with different methods, and different bodies publish different numbers. They shift with age and differ between men and women, partly because essential fat requirements differ. None of them was built to classify an individual, and sitting one or two points outside a band is not a finding about your health. If you use a range at all, use it as rough context for whether your estimate is broadly where you expected, not as a target to chase or a line to fear.
How energy and protein connect to composition
Body composition responds to energy balance and training over months, and a few related estimates help with planning.
Your BMR Calculator result estimates the energy your body uses at rest. The TDEE Calculator adds daily activity on top of that to estimate total energy use. A Calorie Calculator turns those into intake targets, and a Protein Intake Calculator helps plan protein, which supports muscle retention when you are active and in a deficit.
All of these are planning aids built on population equations, with the same estimate caveats as the body fat number itself. Calorie targets are not medical instructions, and protein needs vary with activity, diet, and individual health context.
Common mistakes to avoid
- Trusting the decimal. No consumer method resolves to a tenth of a percent. Round it in your head and watch the trend.
- Switching methods mid-track. A scale reading and a tape formula are not interchangeable. Changing method resets your baseline.
- Comparing across devices. Two BIA scales are two different estimates, not two attempts at one.
- Measuring inconsistently, then reading the noise as change. Most week-to-week movement in home readings is condition, not composition.
- Chasing a number from the internet. Ranges vary by source, age, and sex, and a figure that suits someone else may not suit you.
- Treating the estimate as a health score. It describes one aspect of composition. It says nothing about blood pressure, cardiorespiratory fitness, metabolic markers, or how you feel.
Quick checklist
- Pick one method and stay with it for tracking.
- Measure at consistent landmarks, time of day, and hydration.
- Record each result and revisit in two to four weeks.
- Read three or four readings as a trend, not one in isolation.
- Pair the number with context such as energy, strength, and how your clothes fit.
A note on safety
This guide is educational and does not provide medical advice or assess any individual. A body fat estimate cannot tell you whether you have a health condition, and no online calculator is a clinical measurement. Body fat percentage alone does not determine your health, and a lower percentage is not automatically a healthier one, since the body needs a baseline of essential fat to function.
Avoid using these numbers to justify very low calorie intake, deliberate dehydration before measuring, or fast, drastic weight changes. If you have a medical concern, a history of disordered eating, are pregnant, are managing athletic performance, or notice unusual symptoms, speak with a qualified health professional who can consider your full situation.
FAQ
What does body fat percentage actually measure?
It estimates the share of your body weight that is fat mass, with the remainder counted as lean mass: muscle, bone, organs, water, and connective tissue. It does not directly measure health, fitness, or strength.
Why do body fat estimates vary between methods?
Each method measures something different and assumes something different. Circumference formulas infer fat from shape, BIA infers it from electrical resistance that depends on body water, skinfolds sample fat under the skin at set sites, and DEXA uses X-ray absorption. They are also sensitive to different disturbances, which is why a scale reading and a tape estimate can reasonably disagree on the same morning.
Is a body fat calculator accurate?
A calculator gives a reasonable estimate, not a clinical measurement. It is most useful for tracking change with one consistent method, rather than for pinning down a figure to the decimal.
Is body fat percentage better than BMI?
They answer different questions. BMI uses only height and weight and cannot separate fat from lean mass. A body fat estimate attempts to describe the split. Reading both, and treating each as a screening number rather than a conclusion, is more informative than picking one.
How often should I check my body fat percentage?
Every two to four weeks is usually enough. Composition changes slowly, so more frequent checks mostly capture measurement noise.
What is a healthy body fat percentage?
Published ranges vary by source, age, and sex, and this guide does not set a target for you. A qualified health professional can interpret a range alongside the rest of your health picture.
Sources and further reading
- National Heart, Lung, and Blood Institute, guidance on BMI as a population screening tool:
- National Institutes of Health, overview of body composition measurement methods:
- American Council on Exercise, published body fat percentage reference ranges: