
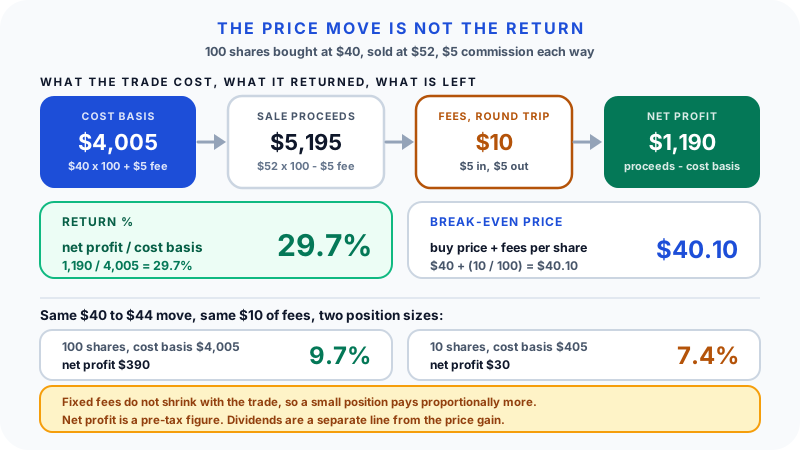
It is easy to feel good about a trade that "went up" and still misjudge how well it actually did. A stock can rise nicely while your real return stays small because the position was tiny, or fees ate the gains, or you forgot that the price had to clear your break-even point first.
A stock profit calculator replaces that gut feeling with two numbers: how much money the trade made or lost, and what percentage that represents on the capital you committed. This guide explains where each number comes from, walks through worked examples, and is clear about the things the arithmetic does not cover. It is written for reviewing trades and understanding returns, not for predicting prices or recommending what to buy or sell.
The five inputs, in plain terms
Almost every disagreement about "how much did I make" comes from mixing up these five quantities. It is worth fixing the vocabulary before touching the formula.
| Term | What it means | Typical mistake |
|---|---|---|
| Buy price | Price paid per share | Using the price you wanted, not the price that filled |
| Shares | Number of shares held | Ignoring it, and judging the trade by the price move alone |
| Cost basis | What the position actually cost you: Buy price x Shares, plus the buy-side fee | Leaving the entry fee out, which flatters the return |
| Sale proceeds | What the sale actually brought in: Sell price x Shares, less the sell-side fee | Confusing gross proceeds with money received |
| Fees | Commissions and transaction charges on both sides | Counting only one leg of the round trip |
Gross proceeds is the raw sale value before anything is deducted. Cost basis is the corresponding figure on the buy side. Profit is simply the gap between them, and the percentage return is that gap measured against the cost basis.
The stock profit formula
Gross profit = (Sell price - Buy price) x Shares
Net profit   = Gross profit - Total fees
Cost basis   = (Buy price x Shares) + Buy-side fee
Return %     = (Net profit / Cost basis) x 100
Gross profit is the raw price move multiplied by how many shares you held. Net profit subtracts the costs of trading. Return percentage expresses net profit relative to what the position actually cost, which is the figure that lets you compare one trade against another fairly, regardless of size.
One note on convention: some calculators divide net profit by the plain purchase amount and some divide by the fee-inclusive cost basis. The gap is usually small, but it is not zero, so pick one convention and use it consistently rather than comparing a figure calculated one way against a figure calculated the other. The examples below use the fee-inclusive cost basis throughout.
Why quantity changes everything
A $5 rise in a share price means very different things depending on how many shares you own. On 10 shares it is $50; on 1,000 shares it is $5,000. The percentage move is identical, but the dollar outcome depends on position size. This is why "the stock went up 12%" is only half the story. Dollars tell you the impact on your account; percentage tells you how efficiently the capital worked. Both views matter, and the calculator produces both from the same inputs.
Worked example: a clean winning trade
Buy 100 shares at $40, sell later at $52, paying $5 commission to buy and $5 to sell.
Cost basis    = (40 x 100) + 5      = $4,005
Gross profit  = (52 - 40) x 100     = $1,200
Total fees    = 5 + 5               = $10
Net profit    = 1,200 - 10          = $1,190
Return %      = (1,190 / 4,005) x 100 = 29.7%
Checking it the other way round gives the same answer, which is a useful habit: sale proceeds after the sell-side fee are (52 x 100) - 5 = $5,195, and 5,195 - 4,005 = $1,190.
The fees only shaved $10 off here because the gain was large. That is not always the case.
Worked example: the same price move on a small position
Now buy just 10 shares at $40 and sell at $44, with the same $5 per side.
Cost basis    = (40 x 10) + 5       = $405
Gross profit  = (44 - 40) x 10      = $40
Net profit    = 40 - 10             = $30
Return %      = (30 / 405) x 100    = 7.4%
The same $40 to $44 move on the 100-share position returns 9.7% after fees. On 10 shares it returns 7.4%. The stock behaved identically. The difference is entirely that a fixed $10 round-trip cost is spread across ten shares instead of a hundred.
This is the single most useful thing a profit calculator surfaces for small accounts: fixed costs do not scale down with your position, so they take a proportionally larger bite the smaller the trade. Frequent small trades pay that cost again on every round trip.
Break-even price
Before a trade is profitable, the price has to rise enough to cover what you paid to get in and out. The break-even price is where net profit equals zero:
Break-even price = Buy price + (Total fees / Shares)For the 100-share trade that is 40 + (10 / 100) = $40.10, a required move of 0.25%. For the 10-share trade it is 40 + (10 / 10) = $41.00, a required move of 2.5%, ten times further. Knowing your break-even before you commit tells you how far the price truly has to move before the trade is worth making, which is often a sobering number for very active trading in small size.
Outcomes at different sell prices
Holding the position fixed at 100 shares bought at $40 with $10 total fees, and varying only the sell price:
| Sell price | Gross profit | Net profit | Return % |
|---|---|---|---|
| $36 | -$400 | -$410 | -10.2% |
| $40 | $0 | -$10 | -0.2% |
| $40.10 | $10 | $0 | 0.0% |
| $44 | $400 | $390 | 9.7% |
| $52 | $1,200 | $1,190 | 29.7% |
| $60 | $2,000 | $1,990 | 49.7% |
The $40 row is the instructive one: selling at exactly your buy price still leaves a small loss, because the fees were real and the price move was not. The next row is the actual break-even.
Percentage return versus dollar profit
Dollar profit answers "how much did my account change". Percentage return answers "how hard did the money work". They can point in opposite directions:
| Trade | Cost basis | Net profit | Return % |
|---|---|---|---|
| A | $20,000 | $1,000 | 5.0% |
| B | $4,000 | $600 | 15.0% |
| C | $4,000 | $600 | 15.0% |
Trade A produced more money. Trade B produced a better return on the capital committed. Neither number is wrong; they answer different questions, which is why comparing trades on dollars alone quietly rewards whoever bet the most.
There is a third dimension the percentage still does not capture: time. Trades B and C look identical above, but if B was held for one month and C for two years, they were not equally efficient uses of the same capital. Comparing raw percentage returns across very different holding periods is misleading. Where you need to put them on the same footing, an annualized figure does that, ((1 + return)^(365 / days held)) - 1, though it is worth remembering that annualizing a short holding period extrapolates a single result across a year that did not happen. The ROI Calculator handles this style of return comparison directly, and What Is ROI? covers the reasoning behind it.
Dividends are a separate line, not part of the price gain
If you held the shares across a dividend payment, that cash is part of what the position returned, but it is not part of the price move and a simple profit calculator will not know about it. Keep the two visible separately:
Price gain     = $1,190   (net of fees, from the example above)
Dividends      = $60      (100 shares x $0.30, paid twice)
Total return   = $1,250
Total return % = (1,250 / 4,005) x 100 = 31.2%
Reporting 31.2% as though it were all price appreciation would misstate what happened, and so would ignoring the $60 entirely. Note also that dividends are typically taxed when received rather than when you sell, which is another reason to track them on their own line. Dividend Yield and the High-Yield Trap covers how yield figures can mislead when read in isolation.
Gross profit versus net profit
Gross profit is the headline; net profit is what reaches your account. The gap between them is every cost of trading: commissions, transaction fees, currency conversion if the stock is listed in another currency, and platform charges.
On a single large winning trade that gap is small enough to ignore. Across many small trades it compounds, because each round trip pays the costs again. A strategy that produces a steady stream of small gross gains can still lose money once the fee drag is counted, and judging it on gross figures hides the leak entirely. Net profit is the honest scorecard.
Realized versus unrealized gains
A gain is unrealized while you still hold the shares. It exists on paper and can vanish if the price falls before you sell. It becomes realized the moment you sell and lock it in.
A stock profit calculator always computes a realized result based on the sell price you type in. If you are still holding, you are modeling a hypothetical sale at today's price, not reporting an outcome. The distinction matters for decisions and for tax, because in many jurisdictions it is the realized gain that triggers a taxable event, and holding period can change the treatment.
Taxes sit outside the calculation
Taxes are usually the largest cost the calculator does not show. Whether a gain is taxable, at what rate, and whether the holding period changes the answer depends on your country, your account type, your other income, and rules that change over time. Some accounts shelter gains entirely. Because none of that generalizes, a profit calculator leaves it out rather than guessing.
The practical takeaway is simply that net profit is a pre-tax number. Your spendable return on a taxable account is typically lower, and estimating the difference is a job for your own tax rules or a qualified professional, not for a general-purpose calculator.
Why your calculator and your brokerage statement may disagree
A simple calculator works from the few inputs you give it. Your statement records everything that actually happened, which is usually more:
- Slippage. Orders can fill at a slightly different price than the one you expected.
- Currency conversion. A foreign-listed stock adds an FX step with its own spread.
- Corporate actions. Splits, consolidations, and mergers adjust your share count or cost basis.
- Small regulatory and exchange fees. Often fractions of a percent, easy to forget, applied anyway.
- Multiple lots. Buying the same stock at different times means the broker applies a specific cost-basis method, which can differ from a single average price.
- Tax withheld or accrued. Tracked by the broker, invisible to a general calculator.
None of this means the calculator is wrong. It models a clean version of a trade; the statement records the complete one. Where they differ, the statement is the record of fact.
What the calculator is good for
It is a review and planning tool. Use it to confirm the real net profit on a completed trade, to find your break-even price before you commit, to compare the percentage return of two trades on a like-for-like basis, and to see how heavily fixed fees weigh on a small position. Run it on the Stock Profit Calculator; if the position is in crypto, where fee structures and round-trip costs often work differently, the Crypto Profit Calculator is the closer fit, and Crypto Profit, Fees, Gains and Losses covers the differences.
What it is not good for: predicting prices, deciding what to buy or sell, measuring risk, or estimating an after-tax result. Those need market research, a plan suited to your circumstances, and tax guidance appropriate to where you live.
Common mistakes
Judging trades by gross profit. Fees, and later tax, can turn an apparent winner into a loss.
Leaving the buy-side fee out of cost basis. It understates what the position cost and overstates the return.
Ignoring break-even. The price must clear the buy price plus per-share fees before anything is made.
Forgetting position size. A large percentage move on a tiny position barely moves the account.
Comparing returns across different holding periods. Fifteen percent in a month and fifteen percent in two years are not the same result.
Confusing unrealized with realized gains. Paper profit is not locked in until you sell.
Folding dividends into the price gain. They are real, but they are a different line with different tax timing.
FAQ
How do I calculate stock profit? Gross profit is (Sell price - Buy price) x Shares. Subtract total fees to get net profit, then divide net profit by your cost basis and multiply by 100 for the percentage return.
What is cost basis? What the position actually cost you: the purchase price times the number of shares, plus the buy-side fee. It is the denominator in the return calculation, and leaving the fee out inflates the result. Brokers may compute it differently when you bought in several lots or a corporate action intervened.
What is the difference between gross profit and net profit on a stock? Gross profit is the raw price gain times shares. Net profit subtracts commissions and other trading costs, so it reflects what you actually keep before tax.
What is a break-even price? The price at which net profit is zero, equal to the buy price plus fees per share. Below it the trade is behind, however good the price move looks.
What is the difference between realized and unrealized gains? Unrealized gains exist on paper while you still hold and can disappear. Realized gains are locked in when you sell, and in many places it is the realized gain that creates a taxable event.
How do fees affect my trading return? Fees lower net profit and raise your break-even price. Because they are largely fixed per trade, they matter most on small positions and frequent trading, where the same cost is paid again on every round trip.
Do dividends count as profit? They are part of your total return, but not part of the price gain, and a basic profit calculator does not include them. Track them separately, both for clarity and because they are usually taxed when received rather than when you sell.
Does a stock profit calculator include taxes? Usually not. Tax treatment varies by country, account type, and holding period, so a general calculator omits it. Treat net profit as a pre-tax figure.
Why do my calculator results differ from my brokerage report? The calculator uses only what you typed in. Differences typically come from slippage, currency conversion, extra exchange or regulatory fees, corporate actions, the broker's cost-basis method across multiple lots, and tax handling.
Educational only. Trading and investing involve risk, including loss of capital. Taxes, fees, and rules vary by country, account type, and individual circumstances. This is not financial, investment, trading, or tax advice.