
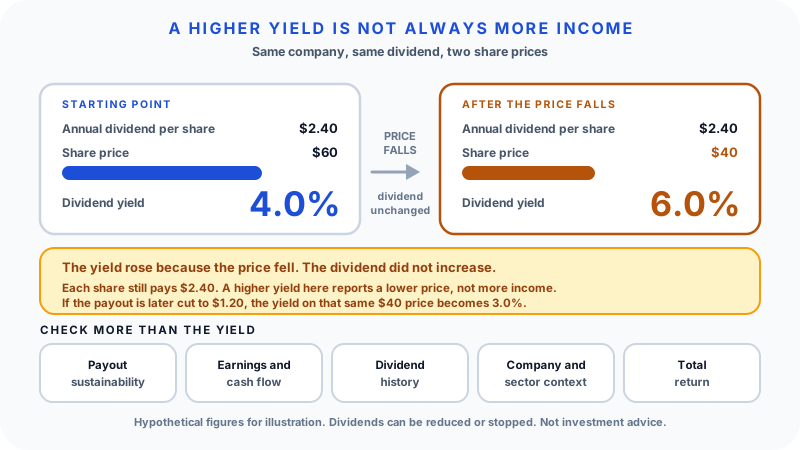
Dividend yield is a ratio, and a ratio has two moving parts. Most people read it as though only the top half matters, so a bigger number reads as a more generous company. But the share price sits underneath, and a price that falls pushes the yield up without the company paying a single extra cent.
That is the whole problem in one sentence. A yield screener sorted from high to low cannot tell you which of the two things happened, and the two things point in opposite directions.
A Dividend Yield Calculator will give you the percentage instantly. This guide is about reading it: what the number measures, what it silently assumes, and which follow-up questions turn it from a headline into useful information.
The dividend yield formula
Dividend Yield = (Annual Dividend Per Share / Share Price) x 100Annual dividend per share is the total dividend attributable to one share over a year. For a company paying quarterly, that is usually the quarterly dividend multiplied by four. Share price is the current market price of one share.
If a stock pays $2.40 per share a year and trades at $60:
(2.40 / 60) x 100 = 4.0%Read that as: at this price, every $100 invested is currently on track to produce about $4 a year in dividends, before tax, for as long as the company keeps paying $2.40.
That last clause carries most of the weight. Yield is a snapshot built from one price at one moment and one dividend the company has chosen to pay and can choose to stop. It is a description of the present, not a projection.
Worked example: how a falling price inflates the yield
Take the same stock: $2.40 dividend, $60 price, 4.0% yield. Now bad news arrives and the price falls to $40. The board has not touched the dividend.
(2.40 / 40) x 100 = 6.0%The yield rose by half. Nothing about the income improved. Each share still pays $2.40, exactly as before. The only change is that the market decided the shares were worth less, which mechanically lifts the ratio.
Now follow it one step further. Suppose the pressure that pushed the price down is real, and the company cuts the dividend to $1.20 to protect its cash:
(1.20 / 40) x 100 = 3.0%Someone who bought at $40 for the "6% yield" now holds a stock paying 3% and has an unrealised loss on the price as well. Both halves of the return moved against them at once. The 6% was never income the company had committed to; it was a ratio produced by a price the market was marking down for a reason.
| Stage | Share price | Annual dividend | Yield | What actually changed |
|---|---|---|---|---|
| Starting point | $60 | $2.40 | 4.0% | Baseline |
| After the price falls | $40 | $2.40 | 6.0% | Price only. Income identical |
| After a dividend cut | $40 | $1.20 | 3.0% | Income halved; price loss stands |
A rising yield driven by a falling price is a question, not a reward.
Forward versus trailing yield
There are two ways to fill in the "annual dividend" slot, and comparing one against the other quietly breaks the comparison.
Trailing yield uses the dividends actually paid over the past twelve months. It is factual but backward looking, so it overstates the income ahead of you when a cut has already been announced.
Forward yield uses the expected dividend for the next twelve months, usually the latest declared dividend annualised. It reflects a recent increase faster, but it is an estimate, and some data sources annualise a special one-off dividend as if it were routine.
Before comparing two stocks, check that both figures are the same type, and check whether the forward number rests on a dividend the board has actually declared or on an assumption that the last one repeats.
Why an outlier yield usually means the market is worried
Share prices move on expectations. A price that has fallen sharply generally reflects concerns about earnings, debt, competition, or the payout itself. Those concerns show up in the price long before they show up in the dividend, because boards are reluctant to cut and will often maintain a payout for several quarters while conditions deteriorate.
That lag is what creates the trap. The dividend stays fixed, the price slides, and the yield climbs to its most attractive-looking level at roughly the point the company is under the most strain. The number is at its most tempting when the underlying position is at its weakest.
This does not make a high yield automatically bad, and there is no percentage above which a yield becomes dangerous or below which it becomes safe. What it means is that an outlier deserves an explanation. If you can find a plausible reason the market is wrong, you have an investment case. If you cannot find any reason at all, you are probably looking at a risk you have not identified yet.
Can the company afford it? Payout ratio and cash cover
The single most useful follow-up to a high yield is whether earnings actually cover the dividend.
Payout Ratio = (Dividend Per Share / Earnings Per Share) x 100A company earning $4.80 per share and paying $2.40 has a payout ratio of 50%. Half the profit goes to shareholders and half stays in the business, which leaves a cushion for a weak year. A company paying that same $2.40 while earning $1.85 has a payout ratio near 130%: it is distributing more than it earns, funded by cash reserves, asset sales, or borrowing. That can continue for a while. It cannot continue indefinitely.
Two refinements are worth knowing:
- Cash matters more than accounting profit. Earnings include non-cash items such as depreciation and write-downs, which can make a payout ratio look alarming in a year when cash generation was fine, or comfortable in a year when it was not. Free cash flow is the harder test of whether the money is genuinely there.
- A dividend funded by debt or disposals is more fragile than one paid out of recurring operating cash, even when the headline ratio looks similar.
Neither check requires modelling. Both are usually visible in a company's own annual report.
Yield sits inside an industry, not across the whole market
Comparing yields across unrelated sectors mostly measures the sectors, not the companies. Different business models retain different amounts of profit for entirely structural reasons.
Mature, capital-heavy, cash-generative businesses such as utilities and telecoms have historically distributed a large share of earnings, because they have limited high-return reinvestment opportunities. Fast-growing companies often pay little or nothing, because reinvesting is expected to be worth more to shareholders than distributing. Neither posture is better; they are different uses for the same dollar.
Real estate investment trusts and similar pass-through structures are a special case worth understanding. In several jurisdictions these vehicles are required to distribute most of their taxable income to keep their tax treatment, so a high distribution rate is a feature of the legal structure rather than a signal about management's confidence. Their payouts are also usually assessed against measures of property cash flow rather than ordinary earnings per share, which means a conventional payout ratio can be misleading. Tax treatment of these distributions often differs from ordinary dividends too, and varies by country and account type.
Cyclical companies distort the ratio from the other direction. Miners, shipping firms, homebuilders, and commodity producers earn very different profits at different points in their cycle. A payout ratio calculated at a cyclical peak looks conservative because the denominator is temporarily inflated; the same dividend measured against mid-cycle earnings may look stretched. Some of these companies address this directly with a small fixed dividend plus a variable component that rises and falls with results, which is a more honest structure but produces a yield that should never be annualised naively.
The practical rule is to compare a company's yield with its own history and with direct competitors, and to treat cross-sector yield rankings as a starting list rather than a ranking of quality.
What a yield trap looks like
A yield trap is a stock whose headline yield does not survive contact with the next set of results. The pattern is consistent enough to recognise:
- The yield is far above the company's own multi-year range, not just above the market average.
- The price has fallen materially over recent months while the dividend has stayed flat.
- Earnings or free cash flow no longer comfortably cover the payout.
- Debt has been rising, or the dividend has recently been funded from sources other than operations.
- Management commentary has shifted from confirming the dividend to describing it as under review.
None of these on its own proves a cut is coming. Several together describe a payout that depends on conditions improving.
Yield is an income measure, not a valuation system
Two related mistakes follow from treating yield as a verdict.
The first is confusing yield with total return. What you earn from a share is the income plus the change in its price:
Total Return = Dividends Received + (Sale Price - Purchase Price)A 6% yield is poor consolation if the price falls 30% over the same period. A 2% yield from a business compounding steadily can produce a far better outcome. For most equities the price component is the larger term, so judging a holding by its yield alone means grading it on the smaller half of the result.
The second is using yield as a valuation tool. Yield says nothing about what a business is worth. It compares a distribution policy to a price, and a distribution policy is a board decision. A company can raise its yield tomorrow by borrowing to fund a larger dividend, which increases the ratio while making the business weaker. Valuation questions need earnings, cash flow, balance-sheet strength, and a view on the future; yield answers none of them.
A checklist for reading an unusually high yield
Before treating a high number as an opportunity, work through these:
- Is it forward or trailing? Confirm which, and whether a cut has already been announced.
- What did the price do? Compare today's price with the past year. A yield that rose only because the price fell has told you about sentiment, not income.
- What is the company's own normal range? A yield well above its own history is the meaningful outlier, more so than one above the market average.
- Do earnings cover it? Calculate the payout ratio, then check free cash flow as well.
- Where is the cash coming from? Operations, or borrowing and disposals?
- How does it compare with direct competitors? Same industry, same yield type.
- Is the structure doing the work? Pass-through vehicles and cyclical variable dividends need different benchmarks.
- Has management's language changed? Reaffirmed, or under review.
- What happens to your total return if the dividend is halved? If that scenario is unacceptable, the position is sized wrong regardless of the yield.
- What will you actually keep after tax? This depends on your jurisdiction and account type, not on the headline figure.
What the calculator does and does not do
A dividend yield calculator divides the dividend you enter by the price you enter. It assumes your dividend figure is accurate and will continue. It does not check whether earnings cover the payout, does not anticipate an increase or a cut, does not include tax, and does not account for price movement, which means it says nothing about total return.
Used as a filter it is genuinely useful: sizing the income a given amount might currently produce, comparing similar income investments on the same basis, and tracking how your own yield on cost changes if a company raises its dividend over the years you hold it. It becomes dangerous only when the output is treated as a conclusion. For anything consequential, pair the Dividend Yield Calculator and the Stock Profit Calculator with the company's own filings, and speak to a qualified professional about your circumstances.
Common mistakes
Sorting by yield and buying the top of the list. That sort surfaces the stocks the market has marked down hardest.
Ignoring cover. A payout above earnings, or above free cash flow, is a candidate for a cut.
Mixing forward and trailing figures when comparing two companies.
Comparing yields across unrelated sectors and reading a structural difference as a quality difference.
Annualising a special or variable dividend as though it were the regular rate.
Treating dividends as guaranteed. They are declared at the board's discretion and can be reduced or suspended.
Judging a holding by income alone when price change is usually the larger part of the outcome.
FAQ
How do I calculate dividend yield? Divide the annual dividend per share by the current share price and multiply by 100. A $2.40 dividend on a $60 share price gives 4.0%.
Why can a high dividend yield be a warning sign? Because the price is the denominator. When a price falls, the yield rises automatically, even though the income has not changed. An unusually high yield often reflects concerns the market has already priced in, and those concerns can end in a dividend cut that reduces income and price together.
What is the difference between forward and trailing dividend yield? Trailing yield uses dividends actually paid over the past twelve months. Forward yield uses the expected dividend for the next twelve, usually the latest declared payment annualised. They diverge most when a company has just raised its dividend or is likely to cut it.
What is a dividend payout ratio and why does it matter? It is the proportion of earnings paid out as dividends. A ratio above 100% means the company is distributing more than it earns, which has to be funded from cash, asset sales, or borrowing, and is usually a sign the payout is under pressure. Checking free cash flow alongside it gives a firmer read.
What is a yield trap? A stock with a high headline yield that does not last. The price fell for a real reason, the payout is not comfortably covered, and the eventual cut damages both the income and the share price.
Is dividend yield the same as total return? No. Yield measures current income relative to price. Total return adds the change in the share price, which for most stocks is the larger component of gain or loss.
Why do REITs and utilities usually show higher yields than technology companies? Mostly structure rather than generosity. Some pass-through vehicles are required to distribute most of their taxable income to retain their tax status, and mature capital-intensive businesses tend to have fewer high-return reinvestment options, so they return more cash. Growth companies typically retain earnings instead. Comparing across these groups compares business models, not management quality.
Does the ex-dividend date affect the yield I receive? It determines whether you receive a particular payment: buy on or after the ex-dividend date and that dividend goes to the seller. Share prices also tend to adjust downward by roughly the dividend amount on that date, which is why buying purely to capture an imminent payment does not create value on its own. It does not change the yield calculation itself.
Educational only. Investing involves risk, dividends can change or stop, and every figure here is a hypothetical illustration rather than a description of any real security. This is not financial or investment advice.