
Gross profit and net profit live on the same income statement but tell very different stories. Gross profit measures the efficiency of producing and selling the product. Net profit measures the efficiency of running the entire business. Confusing them is one of the most common errors in small-business reporting, and one of the costliest, because they imply different actions.
Key Takeaways
- Gross profit = Revenue − Cost of Goods Sold (COGS). It measures product profitability.
- Net profit = Revenue − ALL expenses (COGS, operating costs, interest, taxes). It is the bottom line.
- A business can have strong gross profit and weak net profit (or vice versa); the gap reveals where to focus.
- Gross margin and net margin express each as a percentage of revenue.
- Operating profit sits between the two, excluding interest and taxes.
Where They Sit on the Income Statement
The SEC's Beginners' Guide to Financial Statements describes an income statement as a set of stairs: you start at the top with sales and work down, deducting a different layer of cost at each step until you reach what it calls the bottom line. A simplified version reads:
Revenue
− Cost of Goods Sold (COGS)
= Gross Profit
− Operating Expenses (rent, payroll, marketing, R&D)
= Operating Profit
− Interest Expense
− Taxes
= Net Profit
Each step strips out a different layer of cost. Gross profit answers "how much do we make from each unit?" Operating profit answers "how much do we make after running the business?" Net profit answers "how much actually belongs to the owners?"
Real filed statements carry more lines than this: returns and allowances reduce gross revenue to net revenue, depreciation and amortisation appear as operating costs, and non-operating income sits alongside interest. The five-step skeleton is the shape, not the whole form.
The Formulas
Gross Profit = Revenue − Cost of Goods Sold
Gross Profit Margin = (Gross Profit / Revenue) × 100
Operating Profit = Gross Profit − Operating Expenses
Net Profit = Revenue − COGS − Operating Expenses − Interest − Taxes
Net Profit Margin = (Net Profit / Revenue) × 100
The operating profit margin (also called EBIT margin) is sometimes shown separately and excludes interest and taxes.
What Counts as COGS
COGS includes only the direct costs of producing and delivering what you sell. The exact composition varies by industry.
Manufacturing: raw materials, direct labor, factory overhead, freight in. Retail: wholesale cost of inventory, freight in, direct packaging. Software: hosting costs for customer-facing infrastructure, third-party data costs, customer support directly tied to product delivery. Services: the labor cost of consultants delivering the service, project-specific materials.
COGS does not include sales and marketing, executive salaries, general office costs, R&D, or indirect overhead. Those are operating expenses.
The tax rules draw a similar line. IRS Publication 334 builds cost of goods sold from beginning inventory, purchases, direct and indirect labor, materials and supplies, containers, freight-in, and production overhead, and directs a small business to deduct rent, interest, taxes, insurance, professional fees, depreciation, travel, and general employee pay as separate business expenses instead. Tax treatment and management reporting are not identical, but the underlying distinction between "cost of making the thing" and "cost of running the company" is the same one.
This distinction matters because shifting a cost between COGS and operating expenses changes gross margin without changing net margin. Investors and auditors look closely at COGS composition, and at whether a company classifies it the same way from period to period.
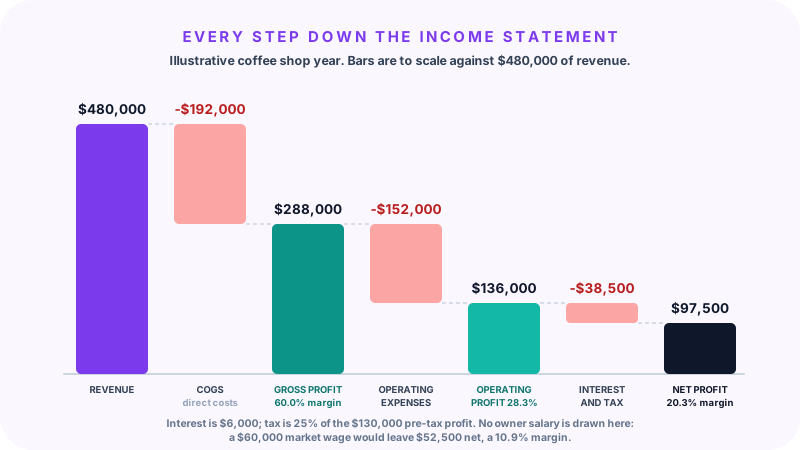
Worked Example: Coffee Shop
Annual figures, using a 25% effective tax rate on pre-tax profit:
| Line | Amount |
|---|---|
| Revenue | $480,000 |
| COGS (coffee beans, milk, cups, food, barista wages) | $192,000 |
| Gross Profit | $288,000 |
| Rent | $48,000 |
| Manager salary | $54,000 |
| Marketing | $12,000 |
| Utilities, supplies, insurance | $24,000 |
| Equipment depreciation | $14,000 |
| Operating Profit | $136,000 |
| Interest on equipment loan | $6,000 |
| Taxes (25% of $130,000 pre-tax) | $32,500 |
| Net Profit | $97,500 |
Check the arithmetic: operating expenses total $48,000 + $54,000 + $12,000 + $24,000 + $14,000 = $152,000, so operating profit is $288,000 − $152,000 = $136,000. Pre-tax profit is $136,000 − $6,000 = $130,000, and net profit is $130,000 − $32,500 = $97,500.
Gross margin: 288,000 / 480,000 = 60.0% Operating margin: 136,000 / 480,000 = 28.3% Net margin: 97,500 / 480,000 = 20.3%
Two things about this example are worth stating plainly, because they are where simplified illustrations usually mislead.
First, barista wages sit in COGS here. That is a defensible choice for a service-heavy food business, but many restaurant operators report a "cost of goods" that covers food and drink only and treat all labor as an operating expense. The same shop would then show a gross margin near 75% and an unchanged net margin. Compare gross margins only between statements that draw the line the same way.
Second, this owner-operated shop shows a 20.3% net margin because no owner's salary is drawn: the owner's compensation is the net profit. Put a market-rate owner's wage of, say, $60,000 into operating expenses and net profit falls to $52,500, a 10.9% net margin. Published small-business benchmarks usually assume the owner is paid, which is a large part of why a simplified example can look far more profitable than the industry figures below.
Now test the sensitivity. If gross margin fell five points to 55%, gross profit would drop by $24,000 to $264,000. With operating expenses and interest unchanged, pre-tax profit falls to $106,000 and net profit to $79,500: a 18.5% fall in net profit from a five-point move in gross margin. That is the leverage a thin gross margin creates, and it is why gross margin discipline shows up in the bottom line so quickly.
Why Gross Margin Discipline Matters
Gross margin is the buffer between revenue and every other cost. If gross margin shrinks:
- Operating expenses become a larger share of the remaining dollars
- There is less room to absorb rent increases, payroll growth, or marketing experiments
- Pricing power weakens, and small discounts become more painful
A business with a 70% gross margin can absorb significant operating cost growth before hitting unprofitability. A 25% gross margin business has very little room for error.
The structural difference is real: software businesses typically run gross margins several times those of grocery retail, because the incremental cost of serving one more customer is close to zero in one case and close to the shelf price in the other. That changes what every operating decision costs, though it says nothing on its own about how the two businesses are valued.
Gross vs Net: Which Tells the True Story?
Both. They answer different questions.
Gross profit tells you:
- Is the product priced correctly?
- Is the supply chain efficient?
- Is direct labor productive?
- Is product mix shifting toward higher- or lower-margin items?
Net profit tells you:
- Is the company actually profitable?
- Is overhead sized appropriately for the revenue base?
- Are interest costs manageable?
- Is tax planning working?
A business can have a 70% gross margin and a negative net margin if operating expenses are too high. Early-stage software companies often fit this profile: strong unit economics, deliberate investment in growth, no current net profit. Conversely, a low-margin distributor can be net-profitable through extreme efficiency on overhead.
Common Mistakes
Calling gross profit "profit." Gross profit is not money in the bank. It still has to pay rent, payroll, interest, and taxes.
Confusing markup and gross margin. A 50% markup is a 33.3% gross margin: an item costing $100 and priced at $150 yields $50 of gross profit on $150 of revenue (see Margin vs Markup).
Leaving fulfilment costs out of COGS. Shipping, payment processing, and packaging are arguably part of COGS for e-commerce and should be tracked there for an accurate gross margin.
Comparing margins across industries blindly. A 5% net margin is strong in grocery and weak in software.
Ignoring trend over level. A 20% net margin trending down for four quarters tells a worse story than a 12% margin trending up.
Mixing accrual and cash accounting. Profit on an accrual basis (revenue when earned) differs from profit on a cash basis (revenue when received). Be consistent.
Industry Benchmarks: Use With Care
Published margin ranges are averages of populations you may not belong to. They mix companies of different sizes, ages, capital structures, and accounting policies, and they say nothing about whether a particular business is healthy. Use them to notice a large gap and then investigate it, never as a target or a verdict.
For a transparent starting point, NYU Stern's Margins by Sector (US) dataset publishes gross, operating, and net margins across thousands of listed US companies with the sample size for each sector stated. In the January 2026 edition, grocery and food retail showed a 26.31% gross margin against a 1.32% net margin, while semiconductors showed 58.97% and 30.45%. Two cautions apply: that dataset covers publicly listed companies, whose scale and cost structure differ markedly from a single-location small business, and margins move with the cycle.
The useful reading is comparative rather than absolute. A business that materially underperforms comparable peers on gross margin has a pricing or direct-cost problem. A business that matches on gross margin but underperforms on net margin has an overhead, interest, or tax problem. That diagnostic works even when the benchmark number itself is only roughly right.
Strategies to Improve Each
To improve gross margin:
- Raise prices (test small increases first)
- Negotiate supplier costs, since savings on direct costs flow straight to gross profit
- Shift mix toward higher-margin products
- Reduce shrinkage, returns, and defects
- Improve direct labor productivity
To improve net margin:
- Reduce operating expenses (rent, software, headcount, marketing waste)
- Refinance debt to lower interest costs
- Review tax treatment with an accountant
- Grow revenue without proportionally growing overhead (operating leverage)
The first set is harder to change quickly but compounds. The second set is faster but has limits.
FAQ
What is the main difference between gross and net profit? Gross profit only subtracts the direct cost of producing what you sell. Net profit subtracts everything (operating expenses, interest, and taxes) to reveal the actual bottom line.
Can gross profit be negative? Yes. It means you are selling each unit below its direct cost. That is unsustainable without a clear plan to fix unit economics.
Is operating profit the same as net profit? No. Operating profit (EBIT) excludes interest expense and taxes. Net profit is what remains after those are paid.
What is a good gross profit margin? There is no universal answer, and any single number quoted as one is wrong somewhere. It depends on the industry, on how the business draws the line between COGS and operating expenses, and on business model. Compare against peers reporting on the same basis, and watch your own trend.
How is net profit different from cash flow? Net profit is an accounting figure that includes non-cash items like depreciation and revenue earned but not yet collected. Cash flow reflects money actually moving. A profitable company can still run out of cash, and a cash-positive company can show low accounting profit.
Why is my gross margin going down? Most common causes: input cost inflation, price discounting, product mix shifting to lower-margin items, or shrinkage. Track each potential cause separately.
What does net profit margin tell investors? It reflects pricing power, cost discipline, and competitive position. Sustainably higher net margins than comparable competitors suggest a structural advantage, though differences in leverage and tax position can also explain part of the gap.
Sources
- Beginners' Guide to Financial Statements - US Securities and Exchange Commission, on how an income statement steps from revenue through cost of sales, gross profit, operating expenses, interest, and taxes to net income.
- Publication 334, Tax Guide for Small Business - Internal Revenue Service, on what belongs in cost of goods sold and what is deducted as a separate business expense.
- Margins by Sector (US) - NYU Stern (Aswath Damodaran), January 2026, the source of the sector margin figures quoted above.
Related Tools
The Margin Calculator computes gross profit, margin percentage, and markup for pricing-side and cost-up decisions. Use the Break-Even Calculator to translate margin into volume requirements.
Related Articles
Final Thoughts
Gross profit is the engine; net profit is the result. A business with strong gross margin and weak net margin needs to look at overhead. A business with weak gross margin and strong net margin is running efficiently but is vulnerable to any increase in direct costs. Read both numbers every month, trend them, and check that whoever you are comparing yourself to draws the COGS line the same way you do. That habit alone separates owners who know their business from those who only see the cash in the bank account.