
A handful of formulas show up in nearly every business decision: pricing, growth, financing, and profitability. Memorizing them matters less than knowing which one answers the question in front of you, and what each one quietly assumes. Most spreadsheet errors are not arithmetic mistakes. They are the right formula applied to the wrong question.
This page is a reference, not advice. It explains what each formula computes and where it stops being valid.
Key Takeaways
- Margin, markup, and contribution margin all describe profit, but against different denominators. They are not interchangeable.
- Simple interest and compound growth are different models. Simple interest is linear; compounding is exponential. Using one where the other belongs is the most common money error in this list.
- ROI has no time in it. Annualized return (CAGR) does. Compare investments of different lengths only after annualizing.
- Break-even uses contribution margin, not gross margin, unless every cost in COGS is genuinely variable.
- Every formula here carries assumptions about timing, constancy, and what counts as a cost. State them before you trust the output.
How to Read This Page
Each formula below is followed by what it measures and, where it matters, the assumption it depends on. Formulas that look similar often answer different questions:
| If you want to know | Use | Not |
|---|---|---|
| What a single sale earns you | Contribution margin | Gross margin |
| What a multi-year investment returned per year | CAGR | ROI |
| What a fixed loan costs per month | Amortizing payment formula | Simple interest |
| What a deposit grows to | Future value | Simple interest |
| How much a price moved | Percentage change | Percentage points |
Percentage Change
Percentage Change (%) = (New − Old) / Old × 100
The base is always the old value. Revenue moving from $80,000 to $100,000 is a 25% increase; moving back from $100,000 to $80,000 is a 20% decrease. The same dollar swing produces different percentages because the denominator changes.
Assumption: the old value is non-zero and the same sign as the new value. Percentage change from a loss to a profit is not meaningful and should be reported in currency instead.
Percentage points are the arithmetic difference between two percentages. A margin moving from 20% to 25% rose by 5 percentage points, which is a 25% relative increase. Mixing the two is a reporting error, not a rounding one.
Profitability Formulas
Gross Margin
Gross Margin (%) = (Revenue − COGS) / Revenue × 100
How much of each revenue dollar survives the direct cost of producing the goods or services. Healthy levels are industry-dependent, so a gross margin is only meaningful against sector comparables or against your own history.
Assumption: COGS contains only costs attributable to production. Where overhead is allocated into COGS, gross margin falls without anything real having changed.
Net Margin
Net Margin (%) = Net Profit / Revenue × 100
The bottom line, after operating expenses, interest, and taxes.
Operating Margin
Operating Margin (%) = Operating Profit / Revenue × 100
Profit from running the business, before financing and tax. Useful because it is not distorted by capital structure, which makes it the fairer comparison between two companies that borrow differently.
Markup
Markup (%) = (Selling Price − Cost) / Cost × 100
Profit relative to cost. Margin is profit relative to price. The two are never equal above zero: a 50% markup is a 33.3% margin. See Margin vs Markup for the conversion math.
Contribution Margin
Contribution Margin = Selling Price − Variable Cost per unit
Contribution Margin Ratio = Contribution Margin / Selling Price
What each sale contributes toward fixed costs. This is the profitability measure break-even analysis needs, because it separates costs that scale with volume from costs that do not.
Break-Even and Cost Coverage
Break-Even (Units)
Break-Even Units = Fixed Costs / Contribution Margin per unit
The unit volume at which total contribution exactly covers fixed costs.
Break-Even (Revenue)
Break-Even Revenue = Fixed Costs / Contribution Margin Ratio
The same answer in currency. Note the denominator: contribution margin ratio, not gross margin. They coincide only when every cost inside COGS is genuinely variable. If any fixed production overhead sits in COGS, using gross margin here understates the volume you need.
Worked Example: Fixed costs $40,000/month. Selling price $50, variable cost $30.
- Contribution margin: $50 − $30 = $20 per unit
- Contribution margin ratio: 20 / 50 = 0.40
- Break-even units: 40,000 / 20 = 2,000 units/month
- Break-even revenue: 40,000 / 0.40 = $100,000/month
Assumption: selling price and variable cost per unit are constant across the range. Volume discounts or tiered shipping break this, and the real break-even sits at a different point.
Interest and Growth
This is where formulas are most often swapped for one another. The three below describe genuinely different things.
Simple Interest
Interest = P × r × t | Final Balance = P × (1 + r × t)
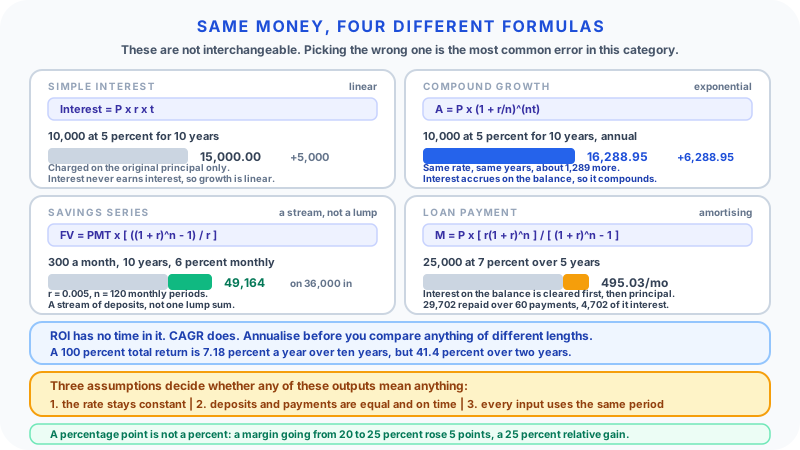
Interest is charged on the original principal only. It never earns interest on interest. Simple interest shows up in some short-term instruments, certain fixed-fee loans, and most back-of-envelope estimates.
$10,000 at 5% simple interest for 10 years: 10,000 × 0.05 × 10 = $5,000 interest, ending at $15,000.
Compound Growth
A = P × (1 + r/n)^(nt)
Interest is charged on the balance, which includes previously accrued interest. Growth is exponential, not linear.
The same $10,000 at 5% compounded annually for 10 years: 10,000 × 1.05^10 = $16,288.95, or $6,288.95 of interest. Compounding adds roughly $1,289 over simple interest at the same headline rate, and the gap widens with time.
Assumption: the rate is constant and nothing is added or withdrawn. See Compound Interest Explained and Simple Interest vs Compound Interest.
Savings Growth With Regular Deposits
FV of a series = PMT × [((1 + r)^n − 1) / r]
What a stream of equal deposits grows to, where r is the rate per period and n the number of periods. This is the savings-plan formula, and it is not the same as compounding a single lump sum.
$300 a month for 10 years at 6% annual, compounded monthly (r = 0.005, n = 120):
300 × [(1.005^120 − 1) / 0.005] = $49,164 on $36,000 deposited.
Assumption: deposits are equal, on schedule, at the end of each period, and the rate does not change. Deposits made at the start of each period are worth (1 + r) times more; that variant is called an annuity due.
Loan and Payment Calculations
M = P × [ r(1 + r)^n ] / [ (1 + r)^n − 1 ]
The fixed payment that fully amortizes principal P at periodic rate r over n periods. A loan is not a simple-interest calculation: each payment covers the interest accrued on the remaining balance first, and only the remainder reduces principal.
$25,000 at 7% annual over 5 years (r = 0.07/12, n = 60): $495.03/month, for $29,702 repaid and $4,702 in interest.
Assumption: fixed rate, equal payments, no fees. Origination fees, insurance, and penalties sit outside this formula, which is why APR and the quoted interest rate differ. See Understanding Monthly Loan Payments.
Return Measurement
Return on Investment (ROI)
ROI (%) = Net Gain / Cost × 100
The basic return measure. It contains no time dimension, so it can only compare investments over the same horizon.
Annualized Return (CAGR)
CAGR = (Final Value / Initial Value)^(1/years) − 1
The constant annual rate that would produce the same cumulative result. This is what makes a 6-month project and a 5-year project comparable.
A 100% total return over 10 years is a CAGR of 2^(1/10) − 1 = 7.18%/year. The same 100% over 2 years is 41.4%/year. Identical ROI, very different investments.
Assumption: both values are positive and the horizon is measured accurately. CAGR smooths away volatility, so it describes the endpoints, not the ride between them.
Payback Period
Payback Period = Initial Investment / Annual Cash Flow
How long until the investment returns its cost in cash.
Assumption: cash flows are even. With uneven cash flows, accumulate them year by year instead of dividing. Payback also ignores the time value of money entirely, and says nothing about what happens after the payback point.
Time Value of Money
Future Value and Present Value
FV = PV × (1 + r)^n | PV = FV / (1 + r)^n
Two rearrangements of the same relationship: what today's money becomes, and what future money is worth now. r is the discount rate per period and must match the period n counts.
Net Present Value (NPV)
NPV = Σ [ Cash Flow_t / (1 + r)^t ] − Initial Investment
Discounted future cash flows minus the upfront cost. Positive NPV means the project beats the discount rate; negative means it does not.
Assumption: the discount rate reflects the real risk and opportunity cost of this project. NPV is far more sensitive to the discount rate than to the cash-flow estimates, which is why the rate deserves as much scrutiny as the forecast.
Internal Rate of Return (IRR)
The discount rate at which NPV equals zero. There is no closed-form solution; solvers find it by iteration.
Assumption: interim cash flows are reinvested at the IRR itself, which is often unrealistic. IRR can also produce multiple valid answers when cash flows change sign more than once. Read it alongside NPV, never instead of it.
Liquidity and Working Capital
Working Capital
Working Capital = Current Assets − Current Liabilities
The near-cash available to fund day-to-day operations.
Current Ratio
Current Ratio = Current Assets / Current Liabilities
Below 1.0 means current resources do not cover near-term obligations. What counts as comfortable above that varies widely by industry and by how fast inventory and receivables actually turn, so compare to sector peers rather than to a universal target.
Quick Ratio (Acid Test)
Quick Ratio = (Current Assets − Inventory − Prepaid Expenses) / Current Liabilities
A stricter read that removes the current assets least likely to become cash quickly.
Cash Conversion Cycle
CCC = DSO + DIO − DPO
Days Sales Outstanding plus Days Inventory Outstanding minus Days Payable Outstanding: the number of days cash is tied up between paying suppliers and collecting from customers. Lower is better, and a negative cycle means customers pay you before you pay suppliers.
Customer Economics
Customer Acquisition Cost (CAC)
CAC = (Sales Spend + Marketing Spend) / New Customers Acquired
The parentheses matter. Total both spends first, then divide.
Assumption: the spend and the customers it produced fall in the same period. With long sales cycles they do not, and a fast-growing company will understate CAC by dividing this quarter's spend by this quarter's wins.
Customer Lifetime Value (LTV)
LTV = Revenue per Customer per Period × Gross Margin × Number of Periods
The gross profit an average customer contributes over their relationship with the business. Use gross profit, not revenue: revenue that costs you 80% to deliver is not worth what it looks like.
Assumption: the revenue figure and the lifespan use the same period. Annual revenue with a lifespan in years, or monthly revenue with a lifespan in months. Mixing the two is the usual source of wildly inflated LTV.
LTV/CAC Ratio
LTV / CAC
A rough health check on unit economics. Below 1.0 each customer costs more than they return. A commonly cited working target in subscription businesses is around 3.0, though it is a rule of thumb rather than a measured threshold, and a very high ratio can equally mean underinvestment in growth.
CAC Payback Period
CAC Payback (months) = CAC / (Monthly Revenue per Customer × Gross Margin)
How many months of gross profit it takes to repay the cost of winning a customer.
Leverage and Capital Structure
Debt-to-Equity Ratio
D/E = Total Debt / Total Equity
Financial leverage. More debt amplifies both returns and losses.
Interest Coverage Ratio
Interest Coverage = EBIT / Interest Expense
How many times operating profit covers the interest bill. The lower it gets, the less room a bad quarter leaves.
Debt Service Coverage Ratio (DSCR)
DSCR = Net Operating Income / Total Debt Service
Debt service is principal and interest, not interest alone. Common in property and small-business lending, where lenders set their own minimum.
Inventory
Inventory Turnover
Inventory Turnover = COGS / Average Inventory
How many times inventory sells through per period. Use COGS in the numerator, not revenue: inventory is carried at cost, so revenue inflates the ratio.
Days Inventory Outstanding (DIO)
DIO = 365 / Inventory Turnover
The same figure in days. A turnover of 8 means inventory sits about 46 days.
Pricing
Selling Price From a Target Margin
Selling Price = Cost / (1 − Margin)
To hit 40% margin on a $30 cost: 30 / 0.60 = $50.
Selling Price From a Target Markup
Selling Price = Cost × (1 + Markup)
A 40% markup on the same $30 cost: 30 × 1.40 = $42. Same percentage, different price, because the denominator is different. Decide which one your target is stated in before you price anything.
Discount Math
Sale Price = Original × (1 − Discount Rate)
Sequential discounts multiply rather than add: Combined Rate = 1 − [(1 − rate1) × (1 − rate2)]. See How to Calculate Discounts.
Worked Example: Putting Formulas Together
A small e-commerce business, one quarter:
- Revenue: $200,000
- COGS: $80,000
- Operating expenses: $70,000
- Interest: $3,000
- Taxes: $9,000
- New customers: 800
- Sales and marketing spend: $24,000
- Average revenue per customer: $40 per quarter, average relationship 8 quarters
Calculations:
- Gross margin: (200,000 − 80,000) / 200,000 = 60%
- Operating profit: 200,000 − 80,000 − 70,000 = $50,000 → operating margin 25%
- Net profit: 50,000 − 3,000 − 9,000 = $38,000 → net margin 19%
- CAC: 24,000 / 800 = $30 per customer (sales and marketing are one combined line here; total them before dividing)
- LTV: 40 × 0.60 × 8 = $192 (quarterly revenue with a lifespan in quarters)
- LTV/CAC: 192 / 30 = 6.4
- CAC payback: 30 / (40 × 0.60) = 1.25 quarters, under four months
The unit economics are strong. Note what the ratio does not say: an LTV/CAC of 6.4 with only 800 new customers a quarter may mean the business is acquiring too cautiously, not that it is winning. Ratios flag questions; they do not answer them.
Now mislabel the period. Take the same $40 as a monthly figure and multiply it by the 8-quarter lifespan: 40 x 0.60 x 24 months = $576, tripling LTV and turning an LTV/CAC of 6.4 into 19.2. Nothing about the business changed. Write the period next to every input before you multiply.
Common Mistakes
Confusing margin and markup. A 50% markup is a 33.3% margin. Pricing off the wrong one systematically underprices.
Using simple interest for a multi-period problem. Anything that accrues on a balance compounds. Simple interest will always understate it.
Reporting ROI without a time horizon. 100% over 10 years is 7.2% a year. Annualize before comparing.
Break-even off gross margin. Use the contribution margin ratio unless you have confirmed every COGS line is variable.
Dropping parentheses in CAC. Sales + Marketing / Customers divides only the marketing spend.
Mismatched periods in LTV. Monthly revenue times a lifespan in years overstates LTV by a factor of twelve.
Treating IRR as decisive. Its reinvestment assumption favours short, small projects. Check NPV.
Percentage points versus percent. A margin rising from 20% to 25% is 5 percentage points and a 25% relative gain. Say which you mean.
When to Use Which
| Decision | Formula | Key assumption to check |
|---|---|---|
| Setting a price | Selling Price = Cost / (1 − margin) | Target is stated as margin, not markup |
| Sales volume target | Break-even units | Price and variable cost constant |
| Evaluating a capital project | NPV | Discount rate reflects real risk |
| Comparing investments of different lengths | CAGR | Both endpoints positive |
| Sizing a loan payment | Amortizing payment formula | Fixed rate, no fees |
| Planning a savings goal | FV of a series | Equal, on-schedule deposits |
| Subscription health | LTV/CAC and CAC payback | Revenue and lifespan use the same period |
| Short-term solvency | Current or quick ratio | Compared against sector peers |
| Debt capacity | Interest coverage, DSCR | Debt service includes principal |
FAQ
What's the most important financial formula for a small business? Contribution margin and break-even. Together they tell you whether each sale makes money and how many sales cover the fixed costs.
When should I use simple interest instead of compound? Only when the contract specifies it, or for a rough single-period estimate. Anything that accrues on a running balance over multiple periods compounds.
How do I choose a discount rate for NPV? Company decisions typically use the weighted average cost of capital; personal ones use your required return. Higher rates penalise distant cash flows more heavily, so test a range rather than a single figure.
Is ROI the same as profit? No. Profit is an amount; ROI is a ratio. A 200% return on $500 produces less money than a 20% return on $50,000.
What's a healthy LTV/CAC ratio? Around 3.0 is the widely quoted working target for subscription businesses, but it is a heuristic, not a standard. Below 1.0 is unambiguously a problem. Well above 5.0 is worth investigating rather than celebrating.
Why do the margin and markup price formulas give different answers? They divide by different bases. Margin is measured against the selling price, markup against cost, so the same percentage produces a different price.
Does break-even tell me when I'll be profitable? It tells you the volume at which you stop losing money at today's prices and costs. It is a threshold, not a forecast, and it moves the moment either changes.
Related Tools
The Margin Calculator, ROI Calculator, and Break-Even Calculator cover the formulas on this page that come up most often. The Compound Interest Calculator handles growth, savings series, and time-value scenarios.
Related Articles
Sources
- US Securities and Exchange Commission, Beginners' Guide to Financial Statements - how an income statement steps from revenue through cost of sales, gross profit, operating expenses, interest and taxes to net income.
- Internal Revenue Service, Publication 334, Tax Guide for Small Business - what belongs in cost of goods sold and what is deducted as a separate business expense.
- US Small Business Administration, Calculate your startup costs - the fixed versus variable cost split that break-even analysis depends on.
- Consumer Financial Protection Bureau, What is amortization? - why a fixed loan payment splits differently between interest and principal over time.
Every worked figure on this page was computed directly from the formula shown and rounded for display.
Final Thoughts
These formulas are measurement tools, not decisions. The same dozen cover most of what a business needs, and the difference between useful and misleading output is almost always an assumption: which costs are variable, which period the numbers cover, whether the rate is fixed. Write the assumption next to the number in your spreadsheet. A year later, that note will be worth more than the calculation.