
"What's a good profit margin?" is one of the most common questions in small business, and one of the least useful without context. A 5% net margin is excellent in grocery, ordinary in restaurants, and alarming in software. Margin benchmarks only make sense within an industry, a business stage, and a cost structure.
The benchmark table below uses the NYU Stern margins-by-sector dataset compiled by Aswath Damodaran, as of January 2026. It is the closest thing to a free, consistent, public benchmark set, and its limits matter as much as its numbers: it aggregates US-listed companies, so it describes public-company economics, not the corner shop.
Key Takeaways
- There is no universal "good" profit margin; every benchmark is industry-specific.
- Gross margin measures product efficiency; net margin measures total business efficiency.
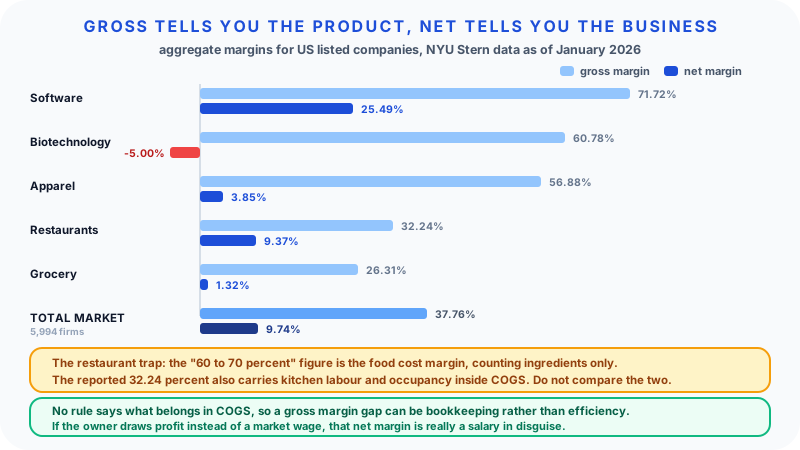
- Across all 5,994 US-listed firms in the January 2026 NYU Stern dataset, the aggregate gross margin is 37.76% and the aggregate net margin is 9.74%. That is the single most useful "middle of the market" anchor.
- Entire sectors can run negative in aggregate. Biotechnology sat at -5.00% net and advertising at -0.30% net in the same dataset.
- Margin trend matters more than absolute level: a 12% margin trending up beats a 20% margin trending down.
- Gross margin is not a standardised figure. Two companies in the same industry can put different costs in COGS, so gross margin comparisons need care in a way net margin comparisons do not.
The Three Margins to Track
Gross Margin = (Revenue - COGS) / Revenue x 100
Measures profitability after direct production and delivery costs. The first line of defence.
Operating Margin = (Revenue - COGS - Operating Expenses) / Revenue x 100
Measures profitability after running the business but before interest and taxes. The cleanest comparison across capital structures.
Net Margin = Net Profit / Revenue x 100
The final bottom line: what owners actually keep.
A healthy business produces consistent or growing margins at all three levels. A weakening trend at any level is a signal worth investigating before it spreads.
One caution before you compare anything. US accounting rules do not prescribe exactly which costs belong in cost of goods sold, so one company may load inbound freight, warehouse labour, or customer support into COGS while a direct competitor books the same costs below the gross profit line. Both are acceptable. It means a gross margin gap between two companies can be a bookkeeping difference rather than an operating one. Operating and net margin are far less exposed to this, because by then the same costs have been counted either way.
Industry Benchmarks
These are aggregate figures for US-listed companies as of January 2026, calculated by NYU Stern. Aggregate means total sector profit divided by total sector revenue, so large companies dominate each row. A typical small private business in the same industry usually earns less, for reasons covered further down.
| Industry | Gross Margin | Net Margin |
|---|---|---|
| Semiconductor | 58.97% | 30.45% |
| Software (system and application) | 71.72% | 25.49% |
| Drugs (pharmaceutical) | 71.73% | 18.54% |
| Computers and peripherals | 38.36% | 17.78% |
| Household products | 51.04% | 11.68% |
| Construction supplies | 25.52% | 10.78% |
| Hotel and gaming | 60.85% | 10.38% |
| Restaurant and dining | 32.24% | 9.37% |
| Retail (distributors) | 30.57% | 6.05% |
| Retail (general) | 33.18% | 5.61% |
| Apparel | 56.88% | 3.85% |
| Trucking | 21.19% | 3.79% |
| Food processing | 23.23% | 2.82% |
| Air transport | 24.79% | 2.51% |
| Retail (grocery and food) | 26.31% | 1.32% |
| Auto and truck | 10.41% | 1.29% |
| Advertising | 36.24% | -0.30% |
| Drugs (biotechnology) | 60.78% | -5.00% |
| Total market (5,994 firms) | 37.76% | 9.74% |
Two things in that table are worth pausing on.
A high gross margin does not guarantee a high net margin. Apparel converts a 56.88% gross margin into 3.85% net, because marketing, stores, markdowns, and returns consume the difference. Biotechnology carries a 60.78% gross margin and still loses money in aggregate, because research spending is booked below the gross line. Gross margin tells you about the product. Net margin tells you about the business.
Restaurant margins are the most commonly misquoted number in small business. You will often see "restaurants run a 60% to 70% gross margin." That figure is real but it is a different measurement: it is the food-cost margin operators use to price a menu, which counts only ingredients. The reported gross margin for listed restaurant companies is 32.24%, because kitchen labour and occupancy are inside COGS. Both numbers are correct within their own convention, and mixing them is how a restaurant owner concludes their business is failing when it is performing normally. Always ask which costs a benchmark includes before comparing yourself to it.
Why Small Businesses Usually Sit Below These Rows
Public-company benchmarks flatter small businesses in one specific way: the owner's pay.
A listed company pays its chief executive a salary, and that salary is already inside operating expenses before net profit is reported. A sole trader or owner-managed company often draws profit rather than a market wage, so its "net margin" is really profit plus unpaid owner compensation.
The correction is straightforward. Subtract what you would have to pay someone else to do your job, then recalculate.
A consultancy with $300,000 of revenue and $60,000 of net profit reports a 20% net margin. If replacing the owner would cost $75,000, the business as an investment is losing $15,000 a year and the 20% margin is really the owner's wage in disguise. This does not mean the business is bad. It means the margin figure was answering a different question than the one being asked.
What Drives a Healthy Margin
Five structural factors set the floor and ceiling of margins in any business:
Pricing power. Can you raise prices without losing volume? Brand strength, switching costs, and lack of close substitutes all expand pricing power.
Cost structure. Fixed-cost-heavy businesses (software, media) scale margin expansion with revenue growth. Variable-cost-heavy businesses (retail, food service) need volume to absorb fixed costs.
Competition density. A crowded market compresses margins toward the cost of capital. Differentiated markets sustain pricing.
Customer concentration. A handful of large customers can demand pricing concessions; a diversified customer base supports margin.
Operational leverage. Once break-even is crossed, each incremental dollar of revenue contributes mostly to profit. Businesses past break-even often see margin expansion year over year.
Worked Example: A Two-Year Margin Trend
This business has no debt and pays tax at 25%, so every line below reconciles.
Year 1
| Line | Amount | Margin |
|---|---|---|
| Revenue | $500,000 | |
| COGS | $200,000 | |
| Gross profit | $300,000 | 60.0% |
| Operating expenses | $230,000 | |
| Operating profit | $70,000 | 14.0% |
| Tax at 25% | $17,500 | |
| Net profit | $52,500 | 10.5% |
Year 2
| Line | Amount | Margin |
|---|---|---|
| Revenue | $650,000 (+30%) | |
| COGS | $234,000 (+17%) | |
| Gross profit | $416,000 | 64.0% |
| Operating expenses | $260,000 (+13%) | |
| Operating profit | $156,000 | 24.0% |
| Tax at 25% | $39,000 | |
| Net profit | $117,000 | 18.0% |
What happened: revenue grew 30% while operating expenses grew only 13%, so fixed costs such as rent and base payroll were spread across more revenue, and supplier negotiations lifted gross margin by 4 points. Operating margin rose 10 points and net margin rose 7.5 points. This is textbook operating leverage.
Notice that net profit more than doubled while revenue grew less than a third. That gearing is what margin trend analysis is looking for, and it works in reverse just as sharply when revenue falls.
How to Evaluate Your Own Margin
Three diagnostic steps:
Step 1: Benchmark against your industry, not against the world. A 6% net margin is poor for software and strong for grocery. Use sector data such as the NYU Stern table above, then adjust downward for the fact that you are probably smaller than the companies in it.
Step 2: Check trend over level. A 12% net margin that has grown from 8% in three years is healthier than a 20% margin that has declined from 25%.
Step 3: Decompose the gap. If your margin is below benchmark, is it gross margin (pricing and input costs) or operating margin (overhead) where you are losing? Each implies different actions. Run the same period through the Margin Calculator at product level to find which lines are dragging the blend down.
Common Mistakes
Treating one number as "healthy" universally. A 10% margin is the lifeblood of one business and a crisis for another.
Comparing gross margins without checking definitions. As above, COGS is not standardised. Confirm what sits inside it before concluding a competitor is more efficient.
Ignoring scale effects. Small businesses often have lower margins than sector aggregates because they lack purchasing power and fixed-cost absorption. Do not compare a 5-person consultancy directly to a listed firm.
Forgetting owner compensation. If the owner is unpaid or underpaid, the reported margin overstates the business.
Optimising margin at the cost of growth. Cutting marketing or R&D boosts short-term margin and erodes long-term position. Biotechnology's negative aggregate margin is that trade-off made deliberately.
Confusing margin and profit. A 30% margin on $100,000 of revenue is $30,000. A 5% margin on $5 million is $250,000. Margin is a ratio; dollars pay the bills.
Reporting margins inconsistently. Mixing accrual and cash, gross and operating, before-tax and after-tax: internal margin reports must use stable definitions to be useful.
Strategies to Improve Margin
Raise prices selectively. Test 5% to 10% increases on lower-volume products first, where the revenue at risk is smallest if demand does move.
Negotiate supplier costs. COGS reductions fall almost entirely to operating profit, because they add no new overhead. In the Year 1 example above, a 5% cut in COGS saves $10,000, lifting operating profit from $70,000 to $80,000, a 14% increase in profit from a 5% change in one input.
Tier your offering. Premium tiers carry higher margins; entry tiers attract volume. The mix improves blended margin.
Reduce overhead waste. Software stacks, redundant tools, underused space: many businesses find recoverable operating expense here without affecting output.
Improve productivity, not headcount. Adding people scales revenue but rarely scales margin. Improving output per person does both.
Review your lowest-margin customers. The smallest-contribution customers often consume disproportionate service time. Reprice before you exit them, since the fixed costs they were covering do not leave with them.
Margin and Business Resilience
Higher-margin businesses generally survive downturns better, but the usual version of this claim quietly assumes every cost is fixed.
Take a business with a 25% net margin, so $75 of cost per $100 of revenue. If revenue falls 15% and no cost moves, it earns $85 - $75 = $10 and is still profitable. A 3% net margin business has $97 of cost per $100 of revenue; a 5% revenue fall leaves $95 against $97 of cost, a loss.
Now relax the assumption. Most of a grocer's cost base is purchased stock, which falls with sales. If 70% of that $97 is variable, a 5% revenue fall takes costs to $93.61 and the business still clears about $1.39. It is thinner, but it is not underwater.
The honest version of the rule: what protects you in a downturn is margin and the share of your costs that shrink when revenue does. A high-margin software business with heavy fixed payroll and a low-margin distributor with a variable cost base can be closer in resilience than their margins suggest. If you want the specific revenue level at which your own cost structure stops covering itself, the Break-Even Calculator answers it directly.
FAQ
What is considered a "good" profit margin? Industry-dependent. Against January 2026 NYU Stern data for US-listed firms, software runs about 25% net, restaurants about 9%, general retail about 6%, and grocery about 1.3%, with the whole market at 9.74%. Compare to peers in your specific sector, not to the market average.
Is gross margin or net margin more important? Both, for different reasons. Gross margin reveals product and pricing health; net margin reveals total business health. Net margin is also the safer number for comparing across companies, because COGS definitions vary but the bottom line does not.
What's a healthy net profit margin for a small business? The common rule of thumb is 10% solid and 20% excellent, and it is worth treating with suspicion for two reasons: it ignores your sector, and it usually ignores unpaid owner labour. Deduct a market wage for yourself first, then compare to your industry row.
Why is my margin shrinking even as revenue grows? Common causes: discounting to drive volume, rising input costs not passed through, mix shifting toward lower-margin products, or operating expenses growing faster than revenue. The Year 2 example above is the healthy version of growth; the unhealthy version has operating expenses growing faster than the 30%.
How do I improve my profit margin? Pick a target margin (gross, operating, or net) and decompose where you are losing. Pricing fixes attack gross margin; cost discipline attacks operating margin; debt and tax planning attack net margin.
Are higher margins always better? Not always. Very high margins can attract competition or signal under-investment in growth. The right margin balances profitability with reinvestment.
How often should I review margin? Monthly at minimum for operating businesses. Quarterly trend analysis is the right level for strategic decisions.
Related Tools
The Margin Calculator calculates gross profit, margin percentage, and markup for product-level pricing. Use the Break-Even Calculator to translate margin into volume targets.
Related Articles
Sources
- Margins by Sector (US) - Aswath Damodaran, NYU Stern School of Business, data as of January 2026. Source for every figure in the benchmark table, the 5,994-firm total-market row, and the sector-level gross and net margins quoted in the FAQ.
Figures were checked against that dataset in September 2026. Sector aggregates move each year, so re-check the current release before using any row in a plan or a valuation. All worked examples are BlinkCalc illustrations, not data from the dataset.
Final Thoughts
The most useful definition of a healthy profit margin is "consistent, trending up, and above your industry peers, after paying yourself properly." Anything below that is a project. Track gross, operating, and net margin monthly, benchmark against your sector rather than the market average, check what a competitor puts in COGS before envying their gross margin, and treat negative trends as urgent before they become structural. A few points of margin protected or recovered over a year often dwarfs the impact of any single growth initiative.